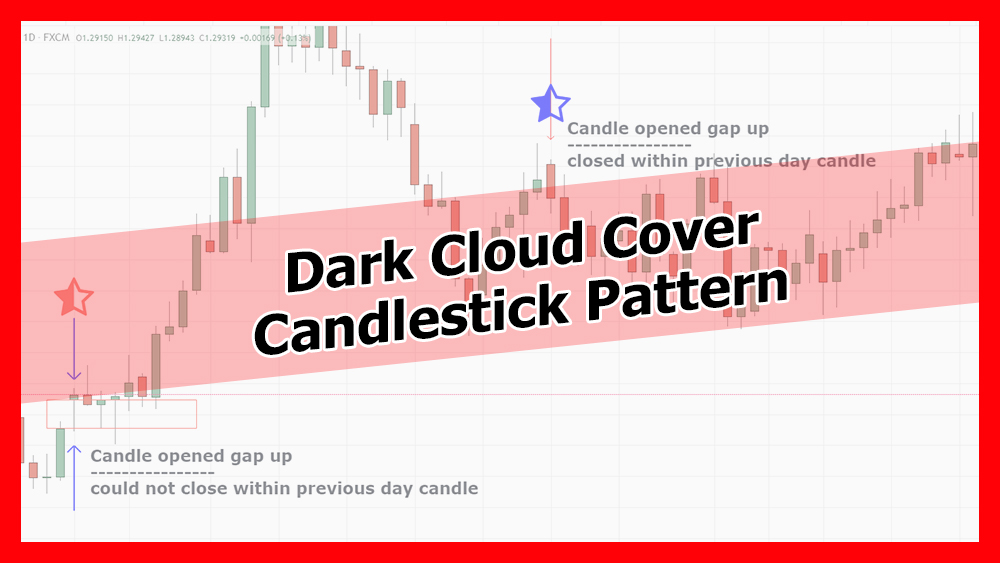
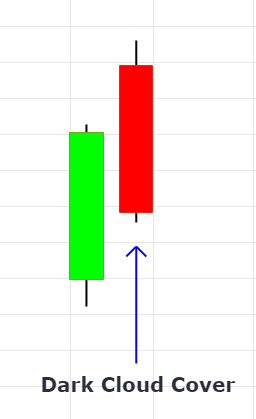
The Dark Cloud cover candlestick pattern is a bearish reversal pattern. It forms once the market has the strong bullish move, the next day market opens with a gap up, and the price close within the previous day’s body. It shows that market has upward momentum but couldn’t hold the price above the previous candle. It shows the buyer strength is weaker and the seller has taken control of the market.
Dark Cloud Candlestick Formation
The Dark Cloud candle open with gap up price. It pushes the price down and the final candle will look like Red Bearish candle. Ideal dark cloud candle closed within 50% of the previous day candle. This triggers a strong bearish momentum and prices usually change its polarity to bearish outlook.
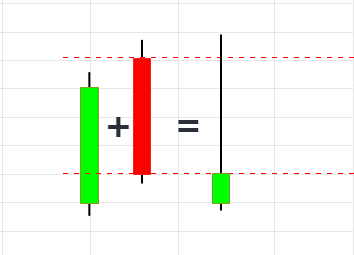
With advance candlestick calculation, if we combine the dark cloud cover with previous day candle, it gives us result as shooting star candle. The below example shows, how cloud cover is actually a shooting star but we can only figure this out, if we know the advance candlestick calculation.
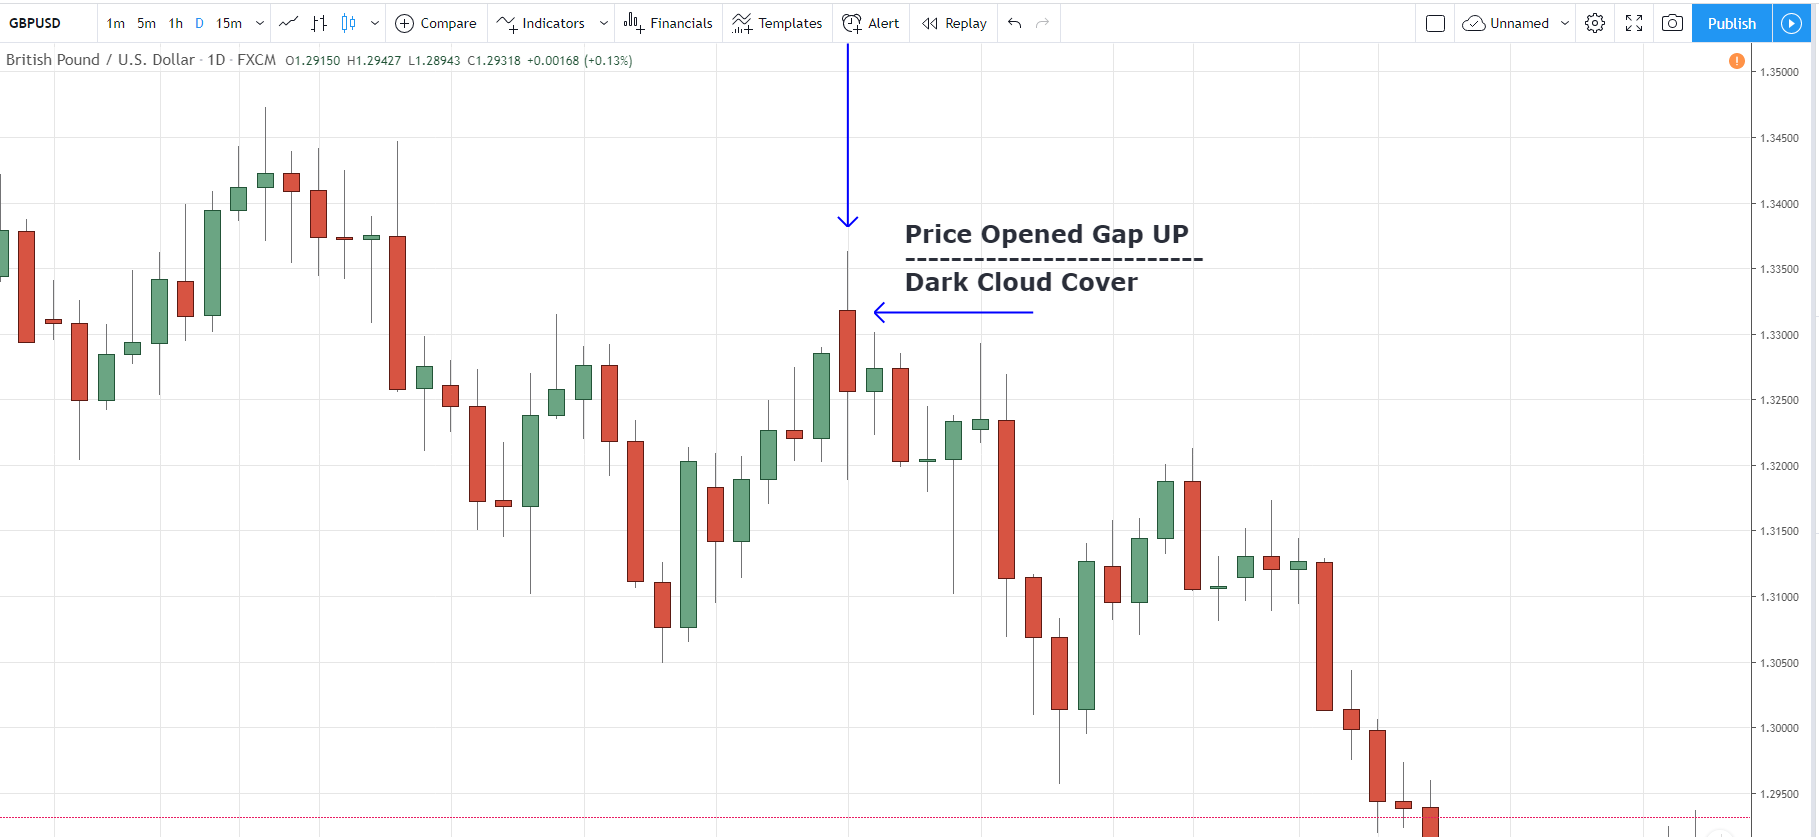
GBPUSD Dark Cloud Candlestick Example
On 19th July 2018, GBPUSD pair created a dark cloud candle. The market opened with a gap up and closed within 50% of the previous day’s candle. As we can see the market changes its direction to bearish and prices started moving down. We have notice shooting star candle after 4 days and it triggers a strong bearish move.
Failed Dark Cloud Candlestick Example
Let’s take another example where the Dark Cloud candlestick pattern failed. On 28th August 2017, the market opened with a gap in price. As shown in the picture with Red Star, the market couldn’t close within the previous candle body. There it nullifies the importance of dark cloud and market moved up.
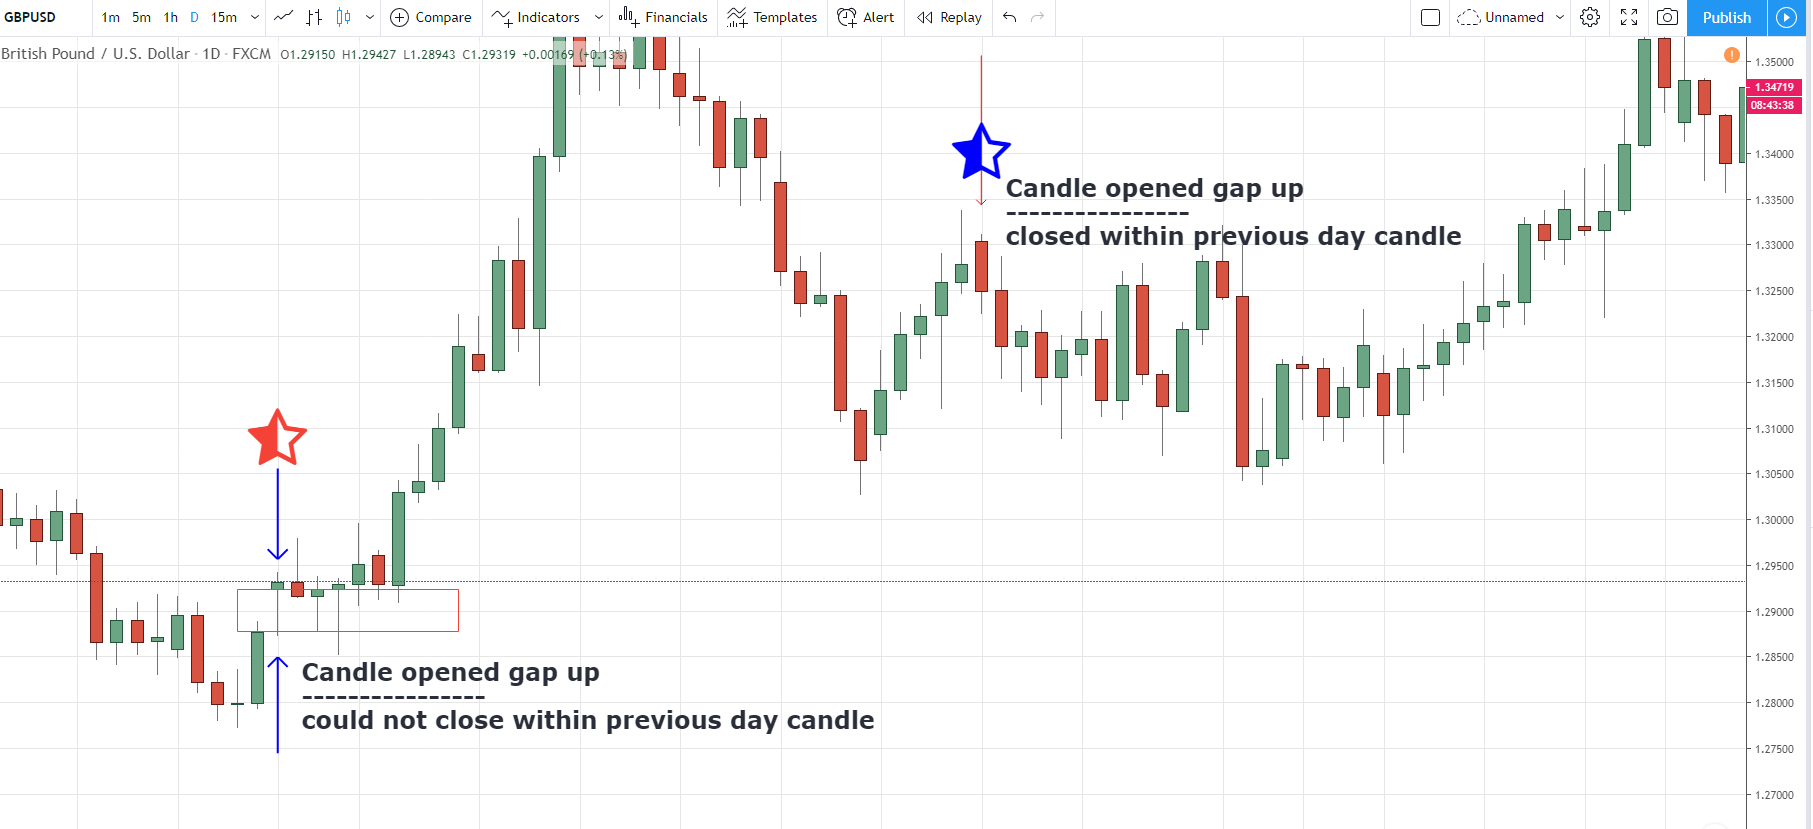
Similarly, on 18th October 2017, the market opened with gap up (as shown with blue star). But this day market managed to close within the previous day candle and form Dark Cloud Cover. Notice the red candle has fully covered the previous day candle and it shows a strong bearish signal.
Now let’s understand how to trade Dark Cloud Cloud.
How to Trade Dark Cloud Cover Candlestick Pattern
Now we understand the formation and pattern, let’s learn how to trade the Dark Cloud Cover candlestick. First, the market will open the gap up, as shown in the example below.
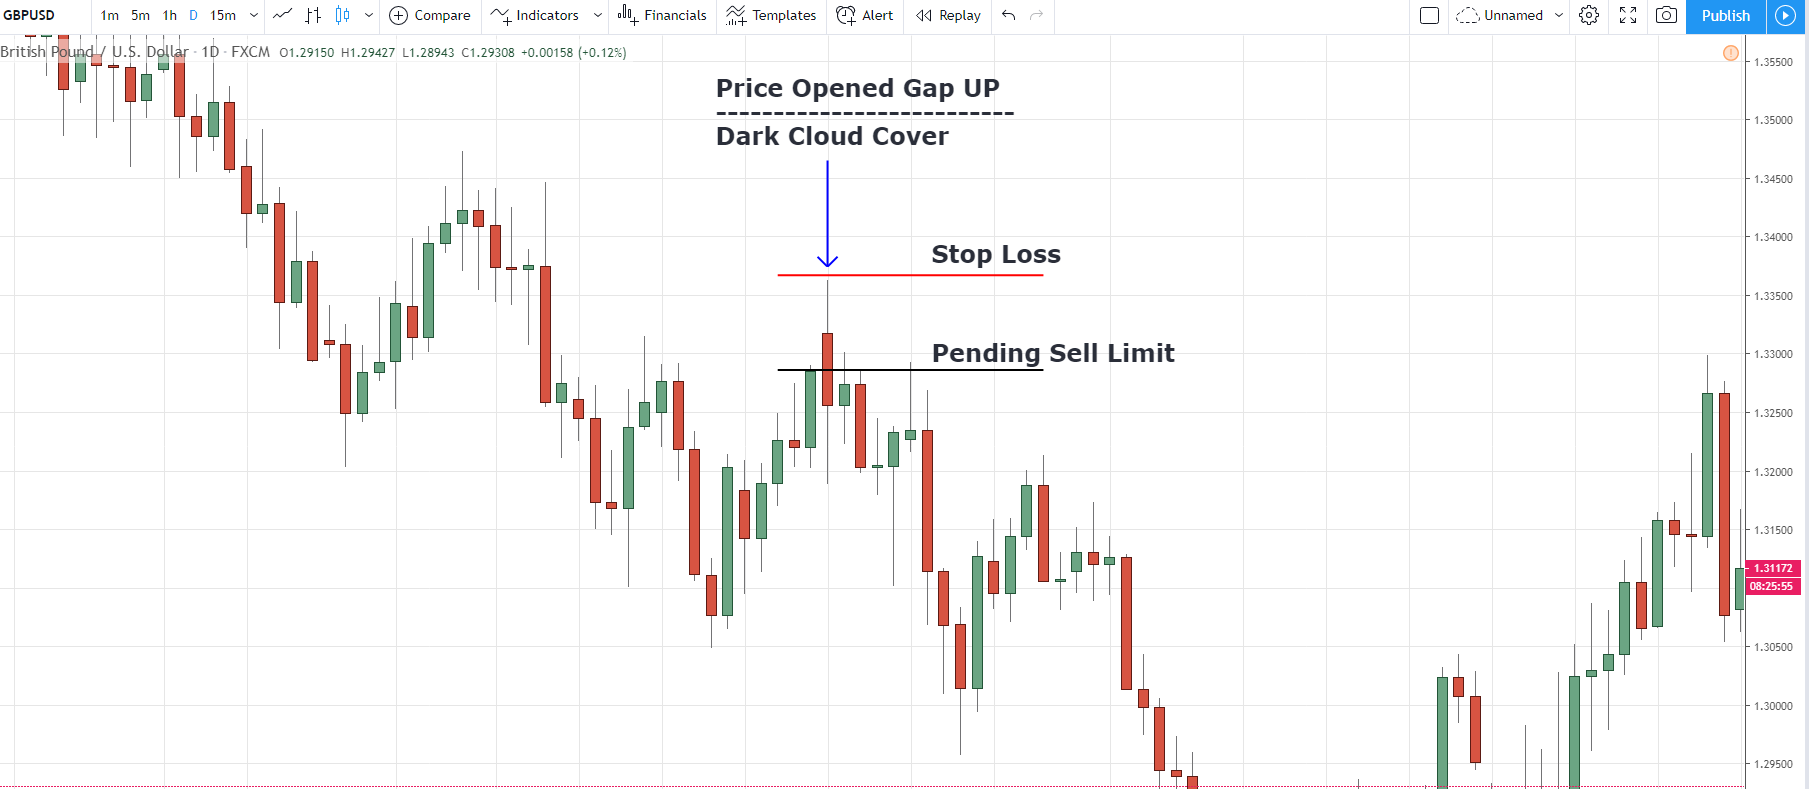
we waited for market to closed within the previous candle, then we will draw a line from the previous day close, all the way to the right side. This line will cross through the dark cloud cover candle. We will label this as Trade Entry Price.
Similarly, we will draw another line at the top of the height of the candle. We label this line as stop loss. So our bias is if the price reverse and moves above the high of the dark cloud cover then we do not want to be in this trade.
In addition to this, through market research, we found the market usually retraces to the close price of the previous day’s candle. Once the dark cloud is formed, we place pending sell limit orders at that price and usually target 3-5%.
Aggressive traders, usually trigger sell orders right after the formation of dark clouds. It depends on what approach the trader uses to trade the dark cloud cover candlestick pattern.