Gravestone Candle is a unique phenomena and it’s a bearish reversal indication in forex, stocks or any trading instrument. It forms when a price open and close at the same point but the full-day trading was more towards long side. It shows market indecision and whole day trading range.
The formation of Gravestone Doji
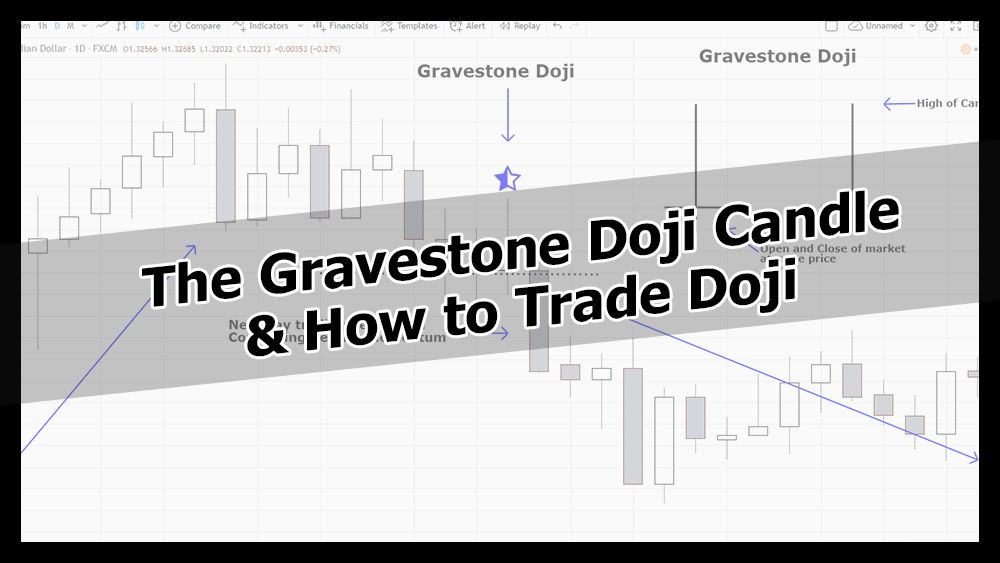
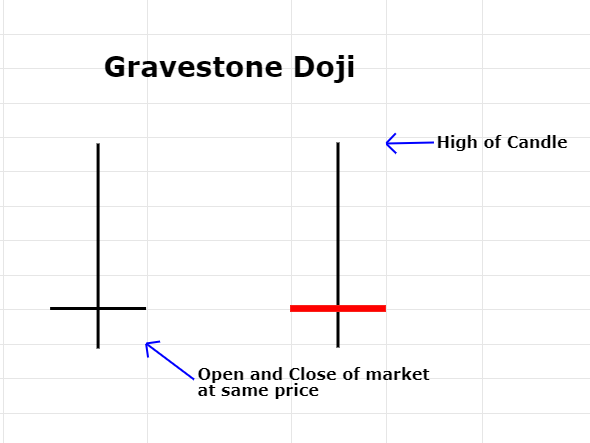
The formation of Gravestone Doji looks like an inverted “T”. It tells the market to open and moves up but the seller pushes the market down all the way to its opening price. Hence it has a long wick at the top and a small body or almost nobody at the bottom. therefore it is also called long wick Doji. The following picture shows that the candle has a long top tail with no or very small body at the bottom. Gravestone Doji candle hints at bullish reversal and rarely occurred. It cannot be used as a confirmed price reversal without confirmation.
How to identify dragonfly Doji – USDCAD Chart example
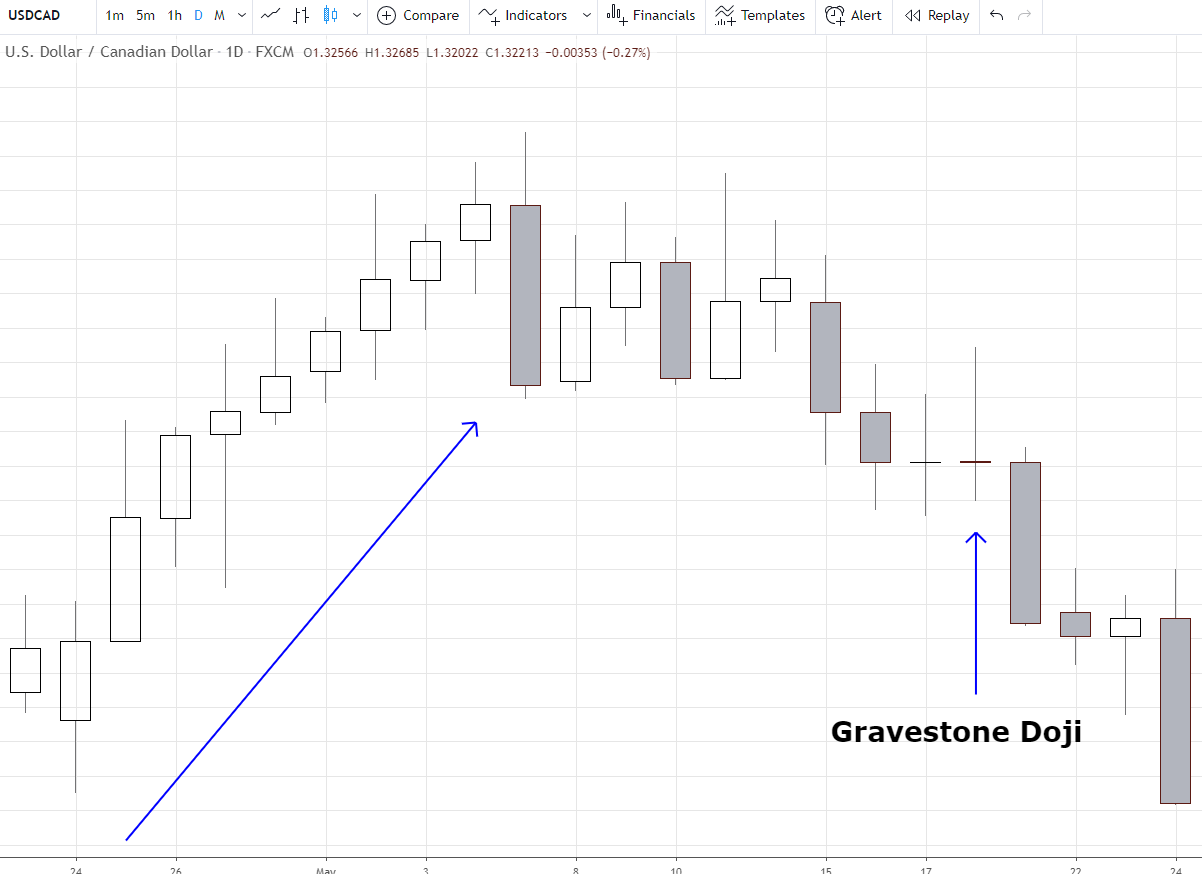
We can see in the following picture that after a strong bullish momentum, we have seen a gravestone Doji and that confirmed the market bearish moment is about to start. In this USDCAD chart, we have seen the price start and ending value was the same with a long tail at the top. The occurrence of gravestone Doji is rare but it always trade with the following day confirmation candle. Let’s have a look at how to trade Doji.
How to Trade Gravestone Doji candle Pattern
To trade gravestone Doji, we always need a next-day confirmation candle if we are trading on a daily chart timeframe. The following example shows that gravestone Doji trend. The next day we wanted for the market to close below the Doji. As we can see the long red candle confirms the bearish momentum.
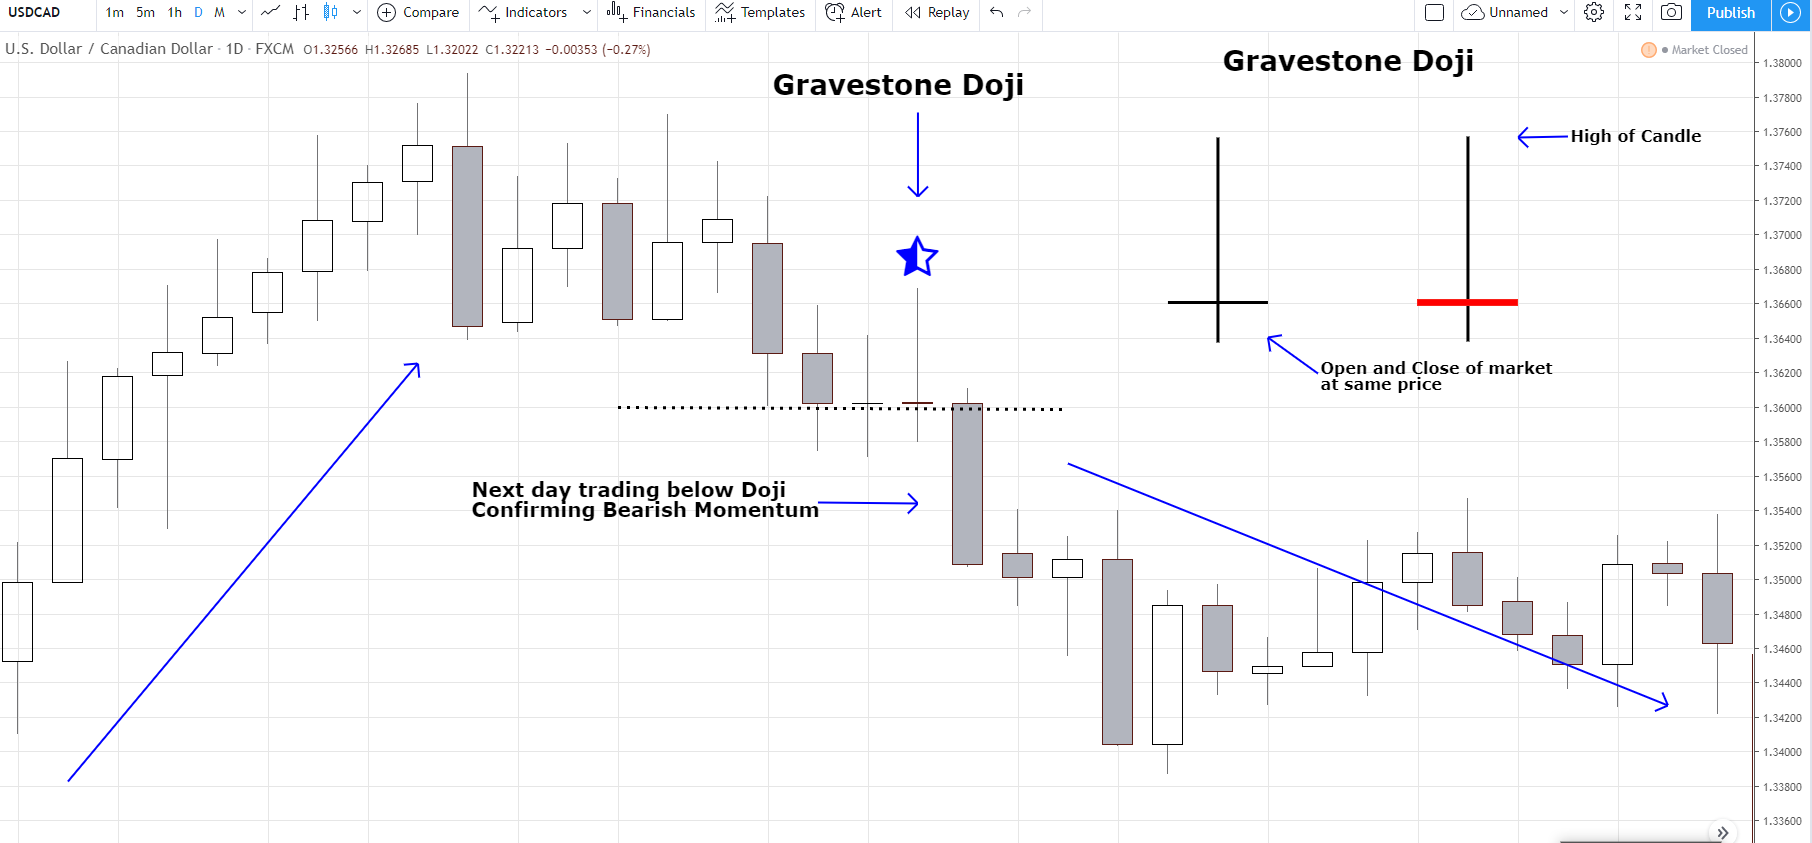
we will trigger sell order with stop loss above the Doji candle high. It display is as Red Dotted line in the picture. This stop-loss covers our maximum loss and we can shoot targets from 2-3% easily.
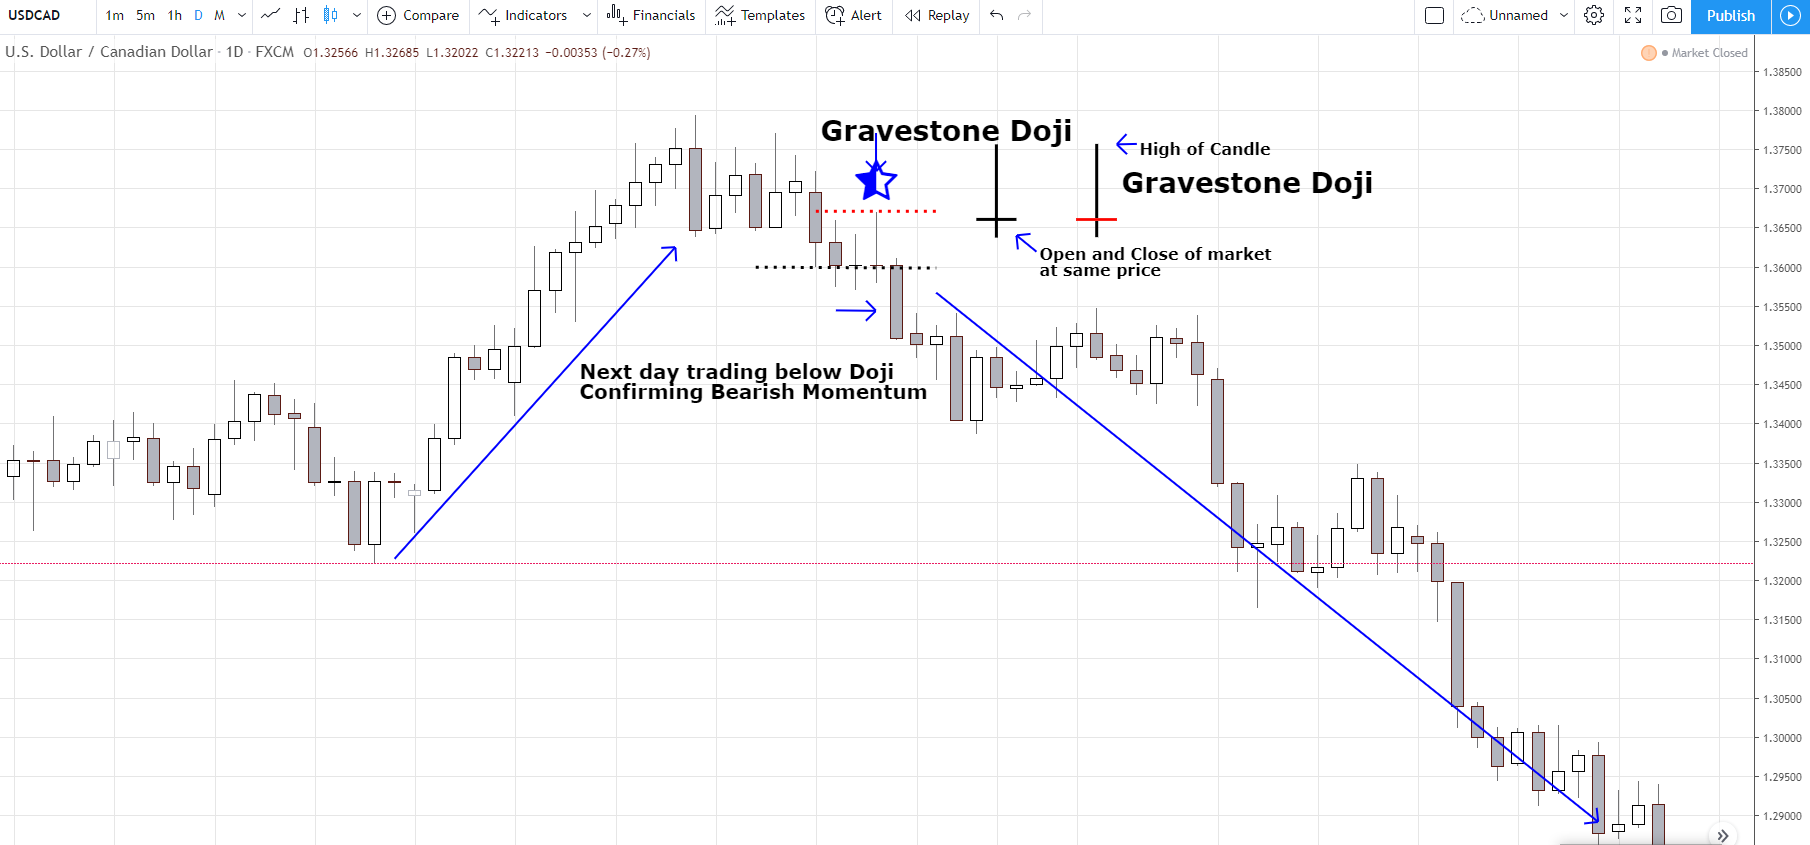
We noticed the market did move down and bearish momentum continue. Therefore it confirms the market has reversed after a strong bullish move. The following picture shows nice profits!
Conclusion
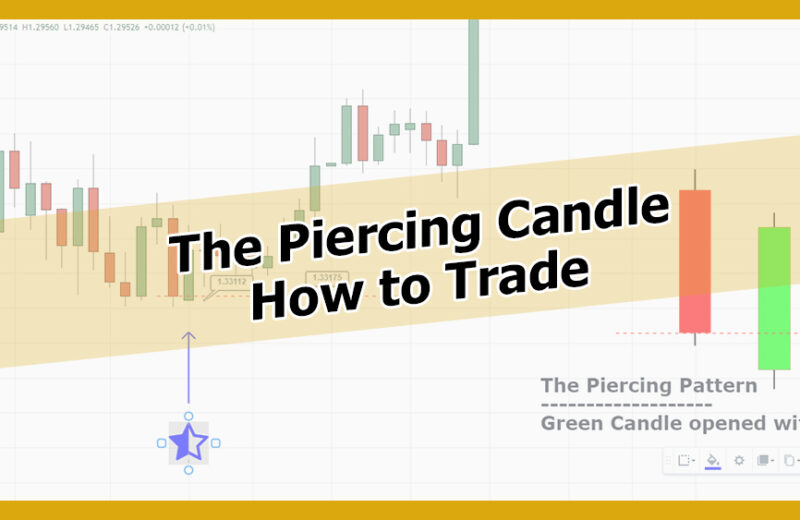
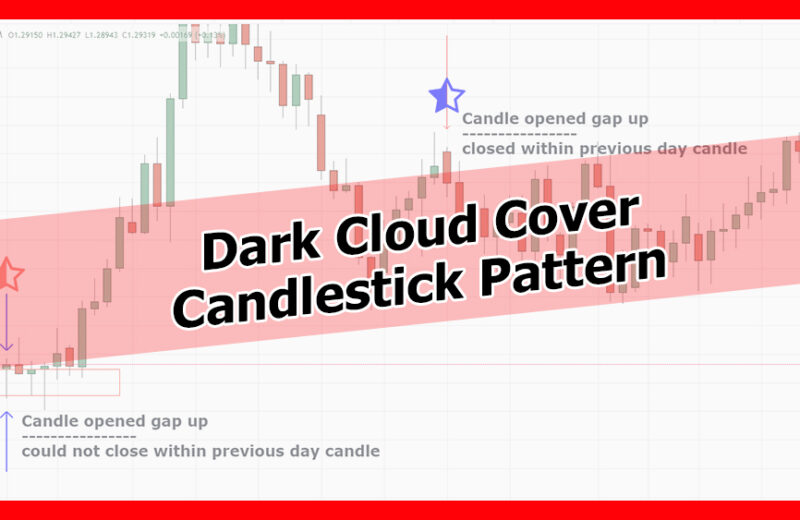
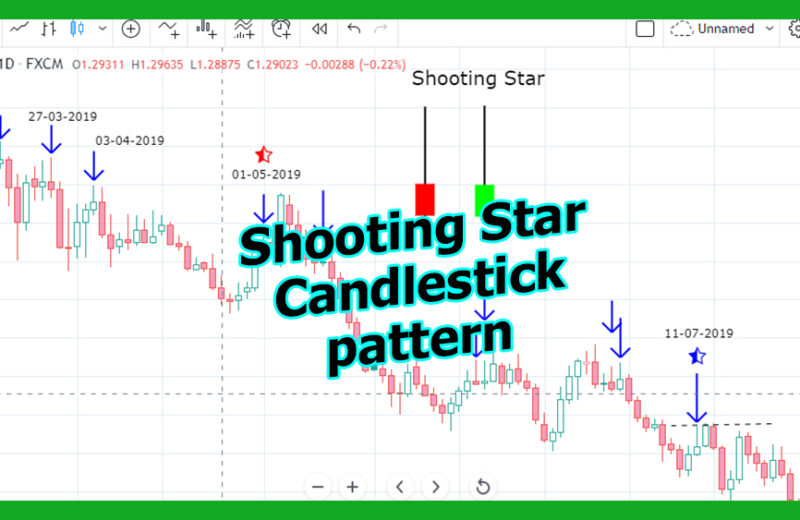
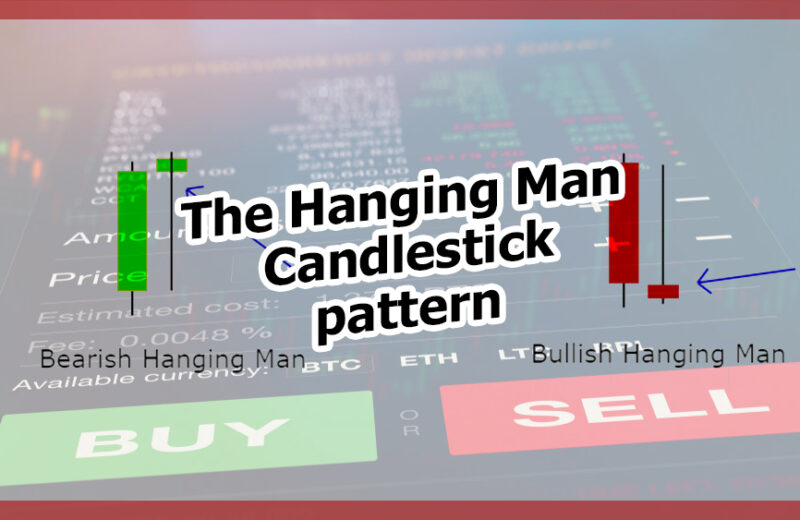
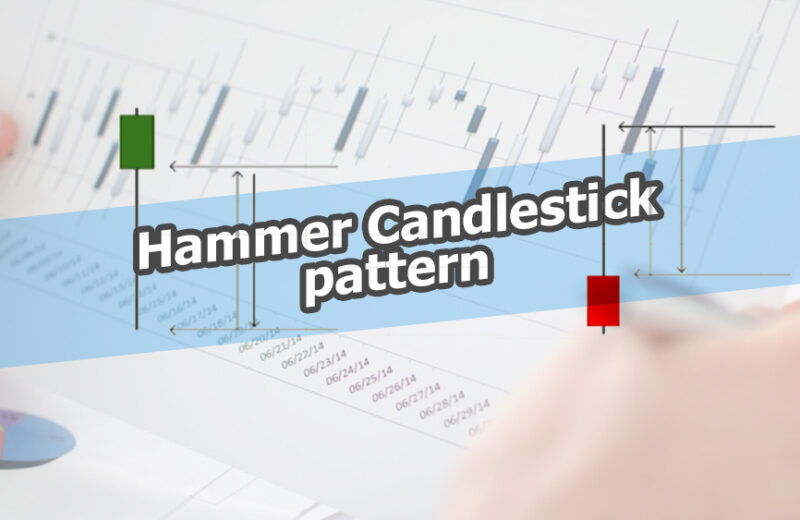
As mentioned, it is rare to see the Doji formation and usually, traders wait for a confirmation candle to change bias. Traders use Doji is hold signals and wait for the next day’s confirmation candle before anticipating the market’s next move. Don’t forget to check Hammer Candle, Shooting Star, Piercing candle, and Dark Cloud candle formation pattern that occurs more frequently, and traders love them!