As the name describe, the hammer candlestick pattern shows the market exhaustion.It is a bullish reversal pattern and usually appears after a strong bearish rally of the market. Hammer or Inverted hammer is a reversal pattern and usually appears to change the polarity of the market. A key point to consider that if an inverted hammer appears in a bullish market, it is called a shooting star candle. similarly, if the inverted hammer appears in a bearish market, that is acts as a bullish signal. Let’s say a bullish hammer will appear, once the market has a strong bearish move. we will cover shooting start in a separate article but Let’s take an example to understand Hammer formation first.
Hammer Candlestick Formation
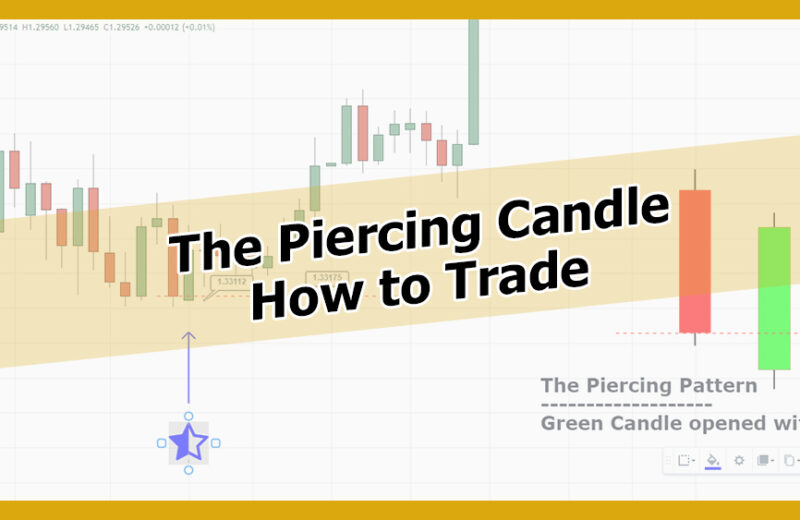
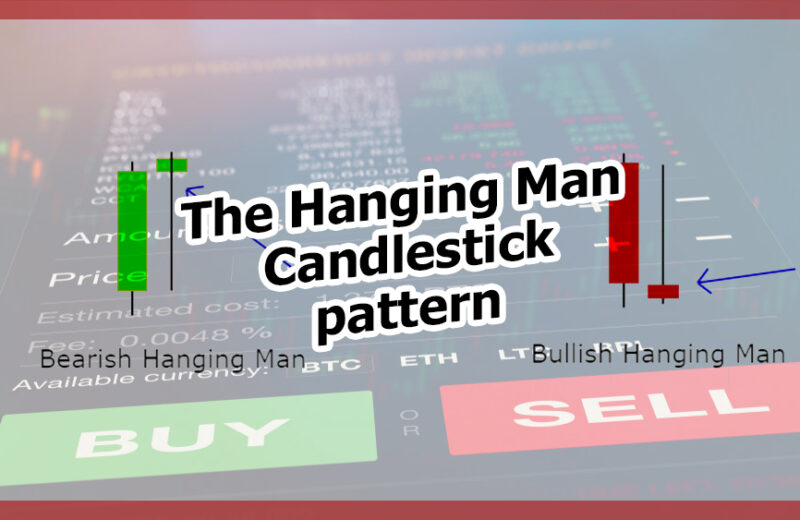
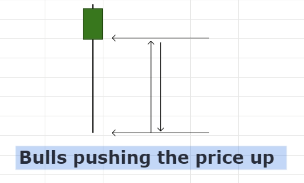
Bullish hammer appears in a strong downward move with long tale and price closing at the top of the price. As shown in the picture below; it’s obvious to see the long tail at the bottom that shows the buyer momentum pushed the price all the way to the top.
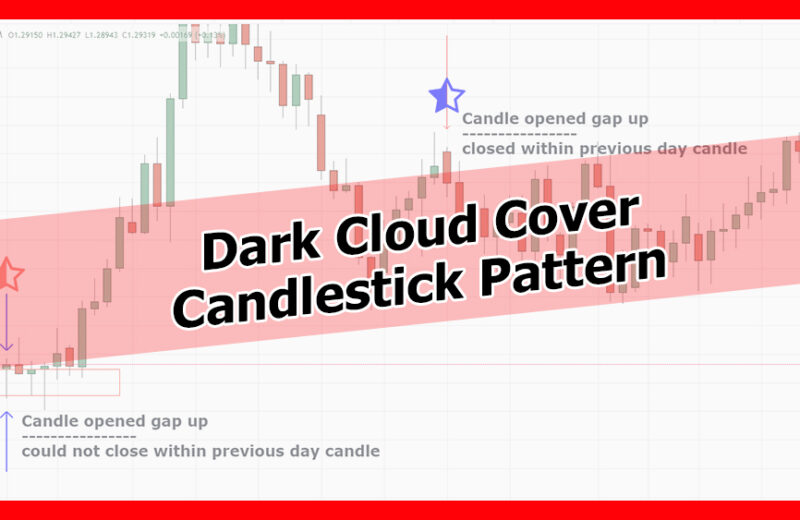
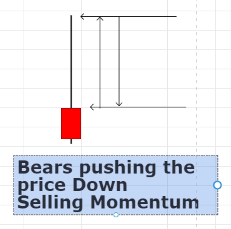
Bullish Inverted hammer appear once the market have a strong downtrend move and then buyer takes control of the market. Bullish Inverted hammer will have long wick upward and price closing near to the bottom of the candle. After inverted hammer, price usually changes the direction.
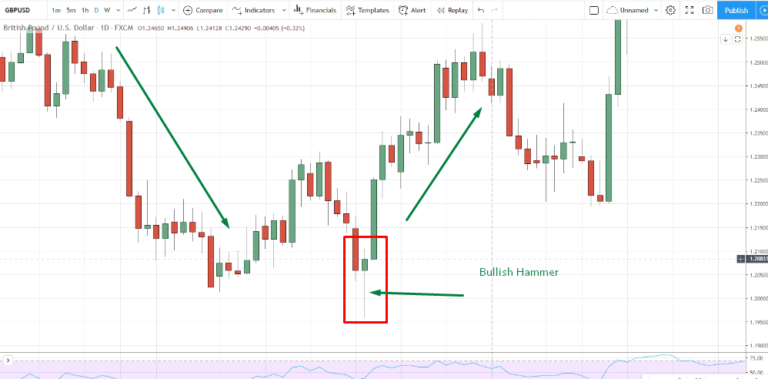
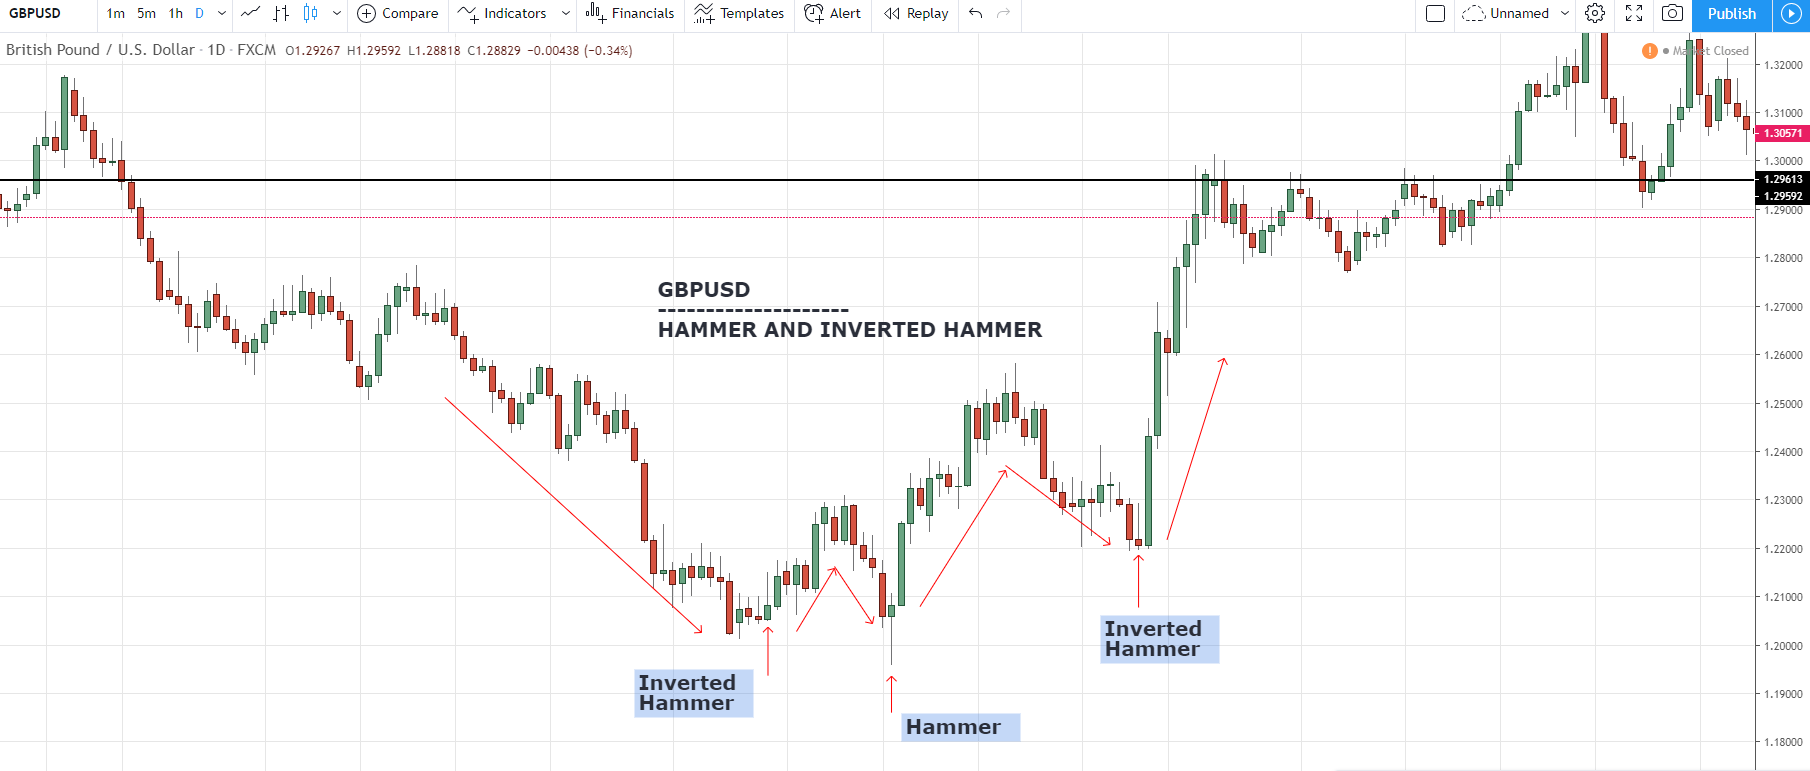
Bullish Hammer GBPUSD example
Now let’s recognize this candlestick pattern in a real-life chart. The following picture shows the GBPUSD currency pair. As the market rally down (sold), the market pushed the price down but buyers took control and push the price all the way up. As you can see the long wick at the bottom shows significant buyer momentum. After that bullish hammer, the market changed its direction to upward.
Bullish Inverted Hammer GBPUSD example
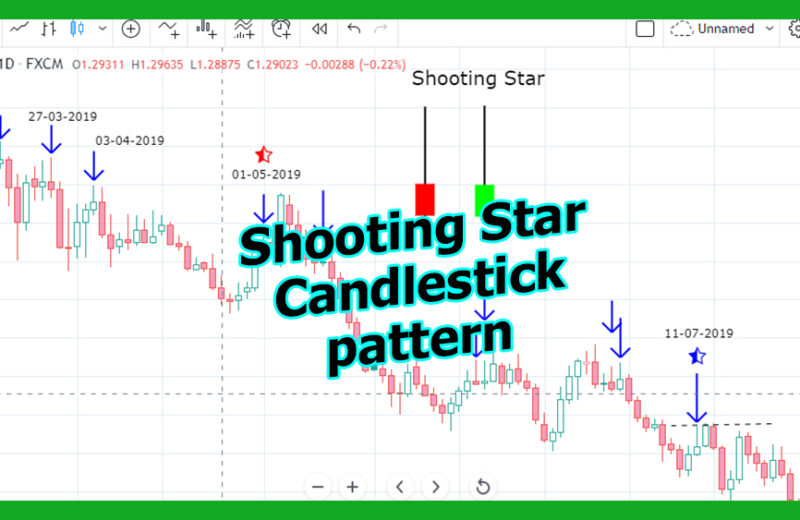
The following picture shows a bullish inverted hammer example. As we can see the market had a strong downtrend move and then a bullish inverted hammer formed. Bear pushed the market down and created a long wick. This suggests strong seller momentum and prices are going low. As we can see in the picture, the market changed its direction and moved up once the next day price closed above the previous day close.
How to Trade Hammer candlestick pattern
It all depends on traders’ approach to trading. Aggressive traders buy or sell the market, right after the hammer is formed. More settled traders may wait for the market to retrace and test the hammer base. Hammer base usually acts as support and they buy price once the price bounces back from support.
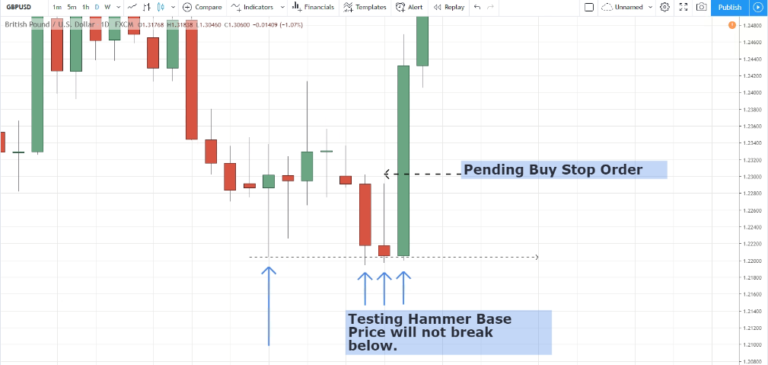
Let’s take an example. The above GBPUSD chart is showing a bullish hammer and we saw the price came back down to test the hammer base which acted as support. At this stage, the trader place a pending buy stop order the above of the previous candle. This will show, if the price reverses and goes up, it will pick the trader trade on the way and the trader will benefit from hammer formation.
The second way is to buy the market, right after the hammer formation with a small contract. If the price retrace then adds into with confirmation.
I hope by now, with the help of the above example you are fully master with hammer candlestick formation recognition and how to trade it!