The Harami Candle occurs when the market closed with a gap but the candle form within the previous candle body. It shows reversal signs and market exhaustion. Harami candle can be bullish or bearish, depending on where it is formed after a market rally.
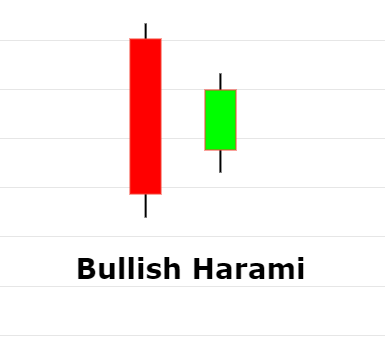
The formation of Harami candlestick
Harami candle formation can be small red body or green body. It’s a small candle that appears in a middle of previous long body candle. The following picture shows a bullish harami formation. As you can see the harami candle is a small candle that reside within previous day long Red candle.
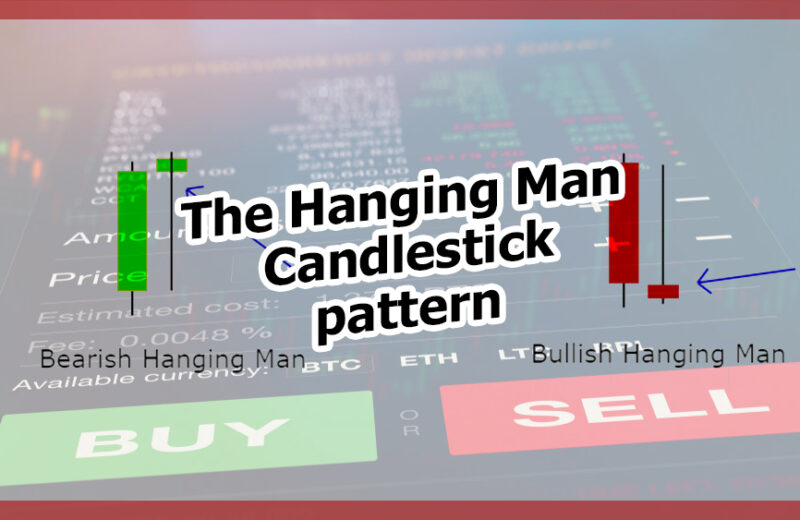
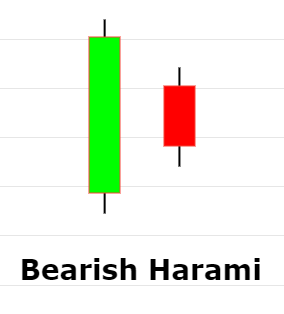
Bearish Harami is opposite to what we discussed above. Bearish hamari is a candle that appears in a middle of a long green candle with small body. we must see upward move before harami appears. It shows the market is weaker and the price sentiment can change towards down side.
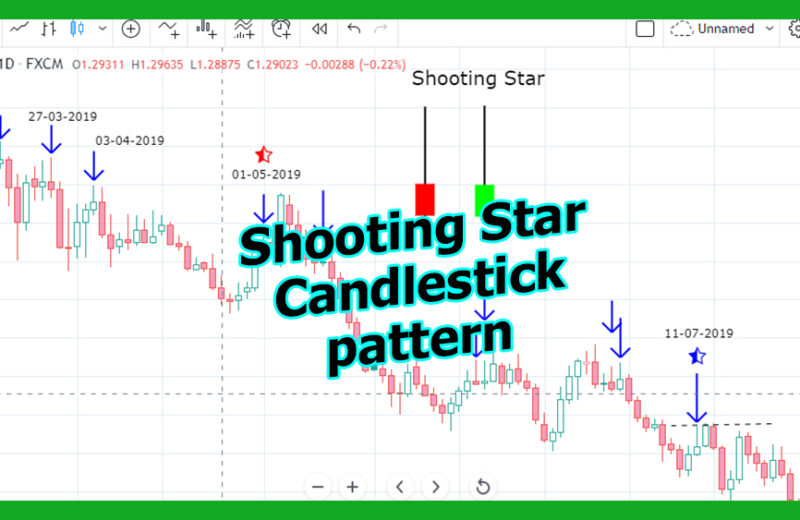
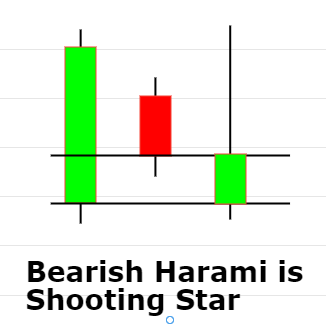
Is Bearish harami is a Shooting Star candle?
Yes a bearish harami is a shooting star candle when we use blending candle approach. As shown in the picture below, both candles are added and the resulted candle was shooting star.
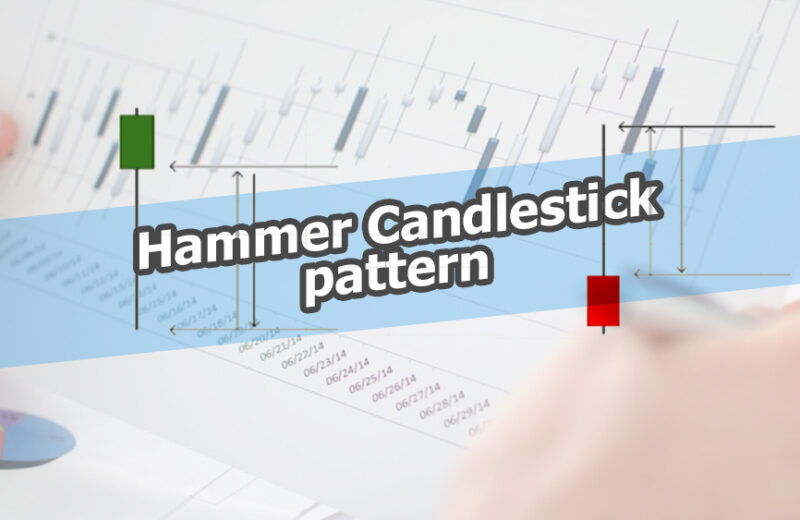
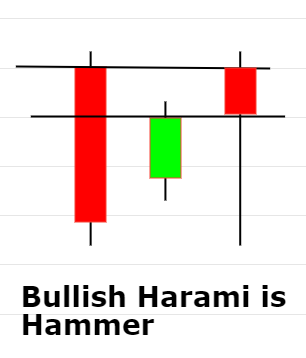
Is Bullish harami is a Hammer candle?
Yes a bullish harami is a hammer candle when we use blending candle approach. We can see in the following picture that if we add both candles the result will be hammer candle.
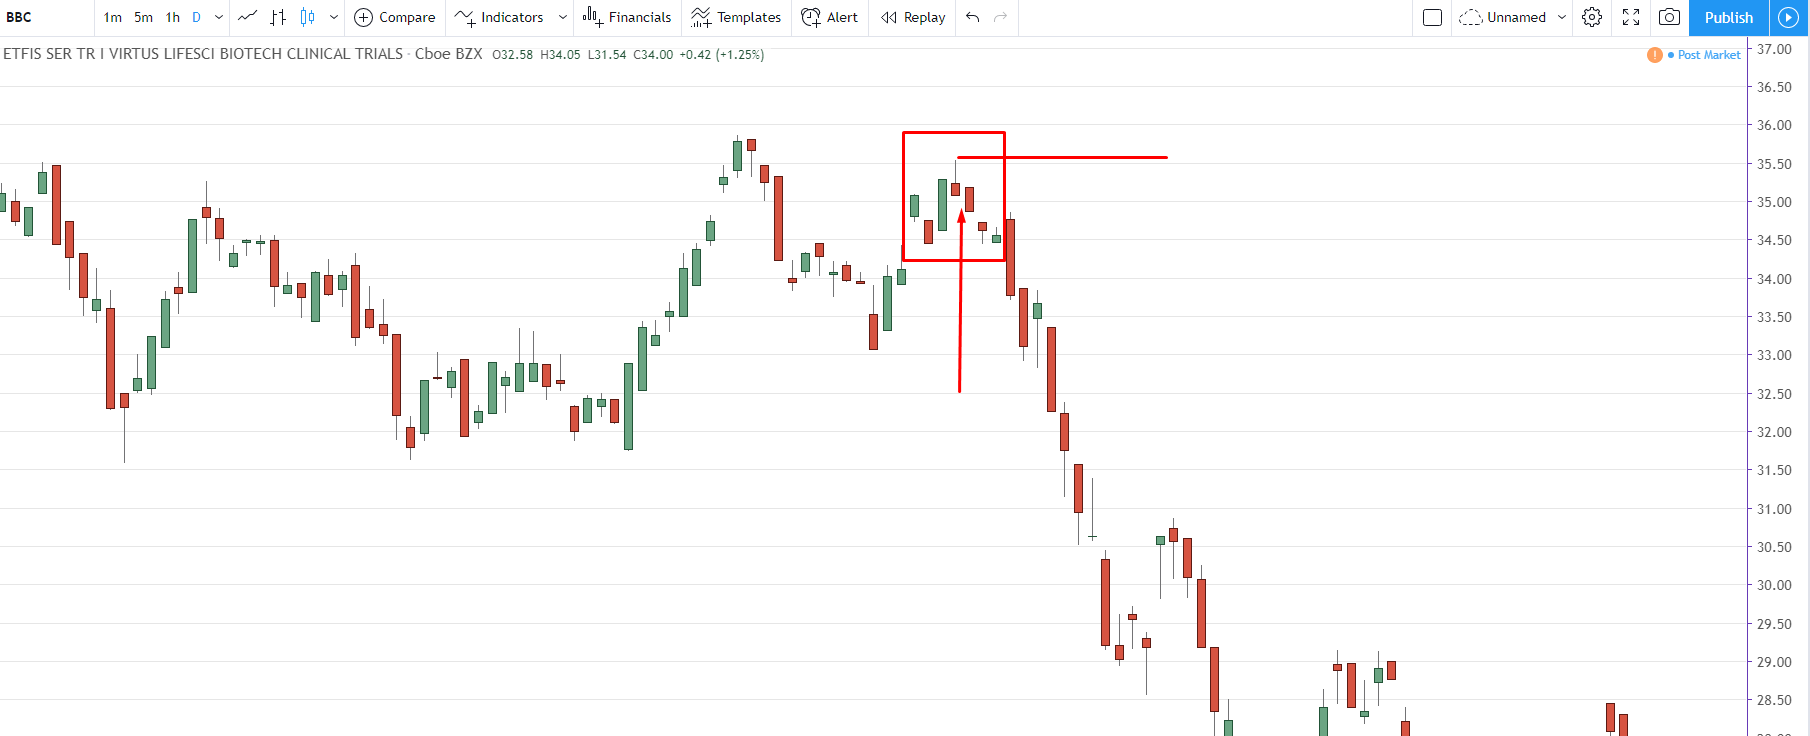
Bearish harami candle example
The following picture shows an example of Bearish harami pattern on BBC Daily Chart. We can see the harami pattern appeared within the previous Green candle. It is shown with red line. We saw the market closed blow the harami and it triggers the bearish momentum.
Now let’s view another example where market consolidated for few days before going down. The following example is Apple Daily chart and as we can see there are two bearish harami’s appeared on this chart. We have represented them with blue arrow.

Market didn’t trigger bearish momentum straight after but consolidated few days before it went down.

Bullish Harami candle example
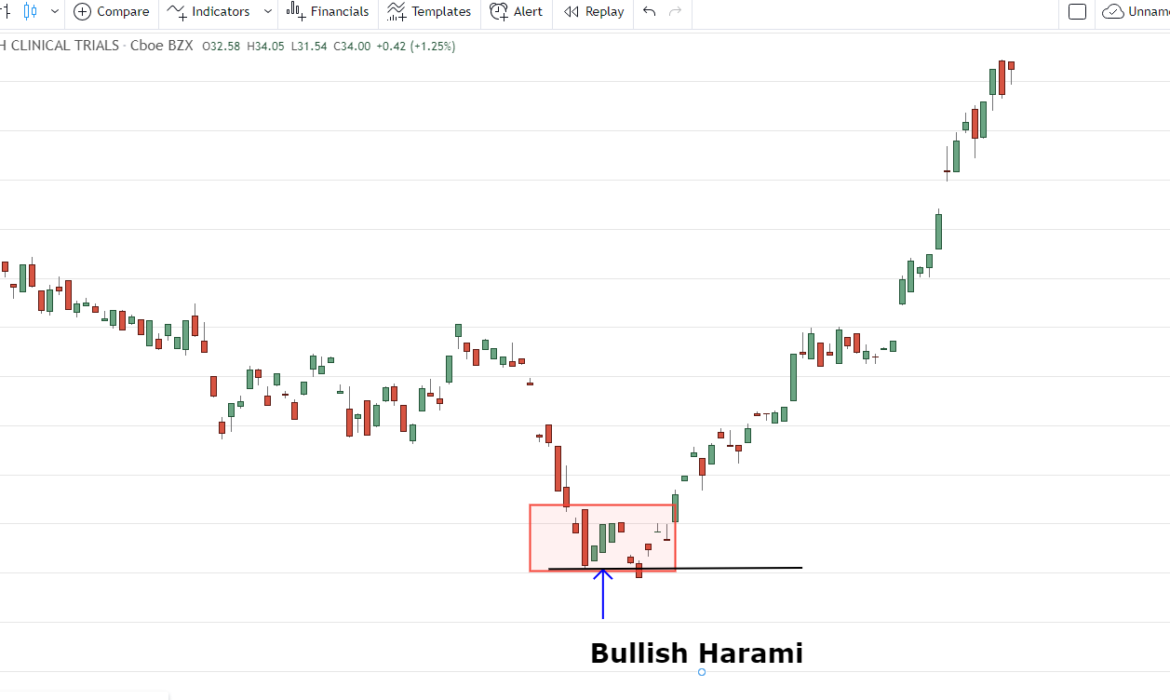
The following example shows bullish harami on BBC Daily Chart. As we can see a bullish harami appeared in the middle of long red candle on 1st October 2019. The price probed once below the black line, and then a strong bullish trend started.
Now let’ see another example of APPLE Chart and find out bullish harami pattern. Bullish harami appeared twice on this chart. highlighted with blue lines, these harami candles are signifying the bullish moment.

As we can see after the harami pattern, the bullish momentum started and market moved up.
How to Trade harami Pattern
As always with like with any candlestick pattern, we wait for confirmation. The following example shows the harami appeared after two bullish engulfing candles.

The way to trade would be place a line at the bottom of lower low. That price would be our stop loss. Trader only takes trades once the price goes out of the previous big candle. As shown in the example, the price went above the black line. We placed that line on top of the big red candle. Once the price moved up, traders trigger the trade with the stop loss below the Red Dotted line. With proper money management, that trade must have gone well!
Conclusion
It’s like with the entire candlesticks patterns, confirmation and patience are key to trade it effectively. In the above example, we saw the price can consolidate few days before the reversal shows up and in some cases, we saw the reaction quickly. it is also important to see if that appears near resistance or support level. Don’t forget to check Hammer Candle, Shooting Star, Piercing candle, and Dark Cloud candle formation pattern that occurs more frequently!