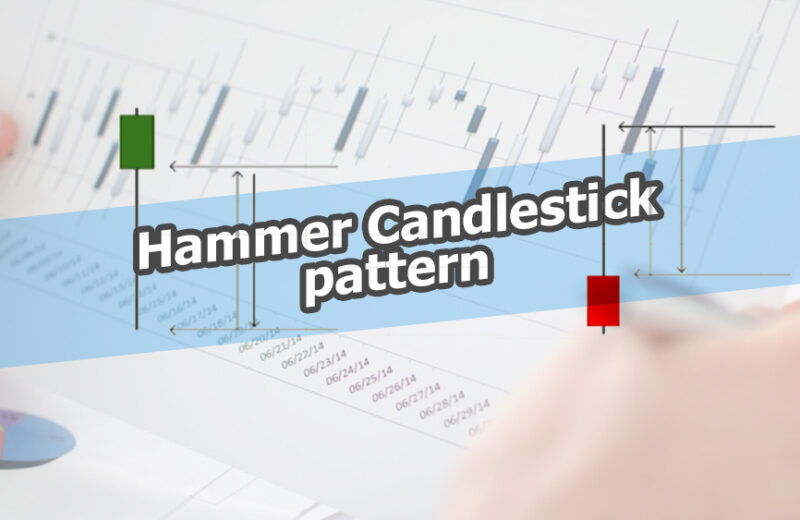
The shooting star Candlestick a bearish reversal pattern and appears after a strong uptrend. It shows the market is losing its esteem and reversal can take place at any time. If the same pattern appears in a downtrend, this pattern is called the inverted hammer and a bullish move can be expected as a reversal. Let’s understand its formation.
Shooting Star Candlestick Formation
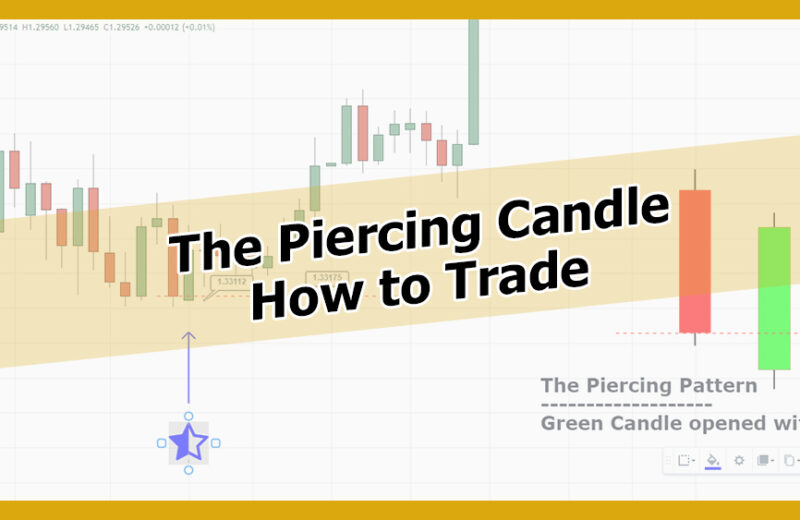
Shooting Star appears in a strong uptrend move with a long tale at the top and price will close at the bottom of the candle. As shown in the picture; it’s obvious to see the long tail at the top that shows the seller momentum pushed the price all the way to bottom but closed near to the bottom.
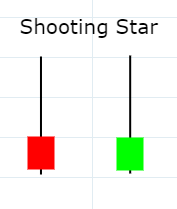
Shooting star usually triggers Bearish reversal after an upward loses its strength and then seller take control of the market. It has long wick upward and price closing near to the bottom of the candle. To understand it fully, let’s take a look at recent GBPUSD move and identify shooting star.
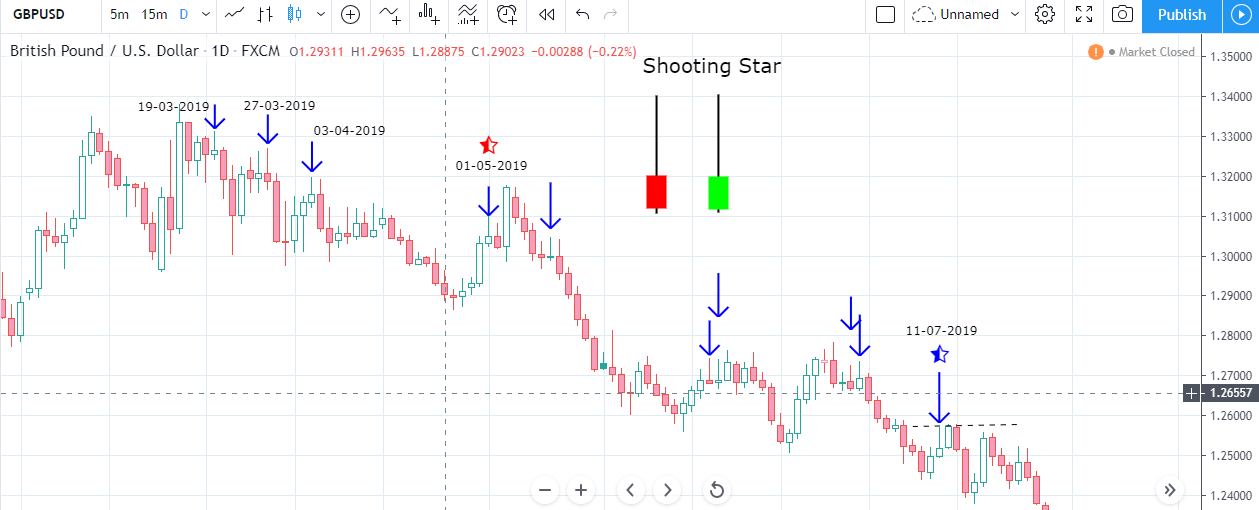
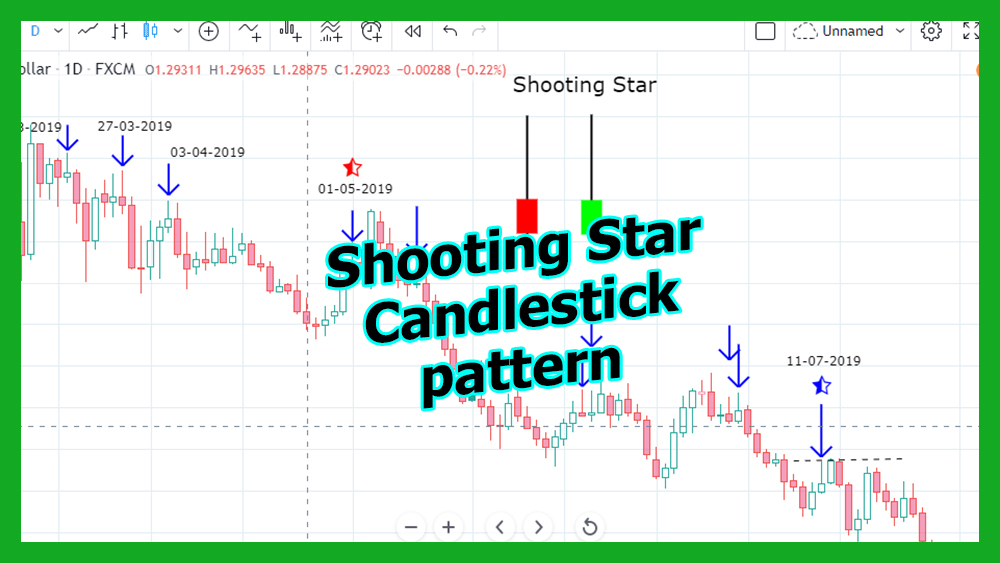
Shooting Star GBPUSD example
As you can in the above picture, there were several points where shooting star appears and the market moved down after that. Let’s pick them one by one.
- On the 19th of March 2019, we saw a shooting star on the Daily Time Frame chart. We observed that the next day, the market closed below the shooting star and hence the price moved down.
- The same things happen on 27th March and 4th April, where we saw shooting started after a push-up and as a result, the market went down.
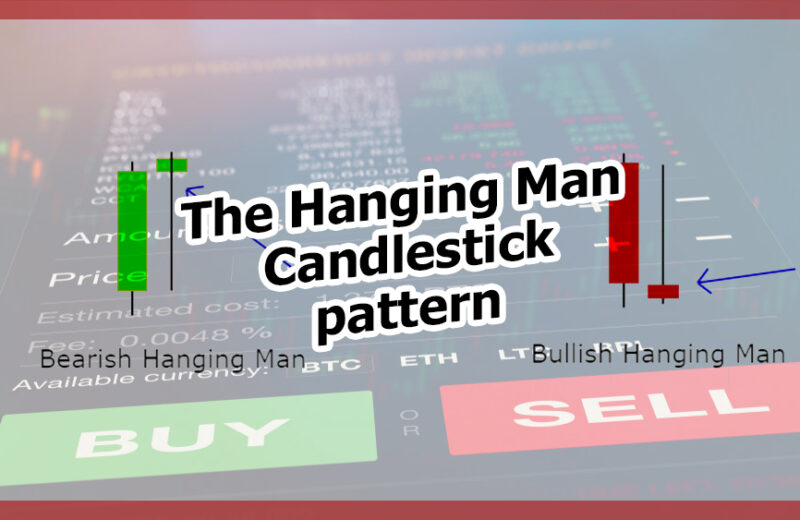
- 1st of May is an interesting pattern. We saw shooting stars but the next day market traded above this. It nullifies the significance. What saw after that was a strong bullish candle with two bear candles follows. With the help of advance candlestick blending techniques can decipher that move and the candle will look like a hanging man candlestick which is a bearish signal. We saw the market down after that.
- On the 11th of July 2019, the market made another shooting start. The following day the market closed above the shooting star but didn’t close above to the high’s of the candle. We call it testing resistance and then the market came back and the bearish trend continues.
How to Trade Shooting Star candlestick pattern
There are two approaches as with any trader. The aggressive trader will click sell right after the shooting star appears. The seasonal trader wants to see the test of the resistance and will trigger trade only once the market closed below the shooting star candle.
Considering the above example of the GBPUSD chart, on the 11th of July 2019, the market formed a shooting star. Then the price went up to test the long wick end price that acted as resistance. Market reverse from that point and came back with the start of bearish trend continuation. Traders usually place the trade once the price closed below the shooting star candle with stop loss above the long wick of a candle.
As we have seen in the example picture, all trades must have given good returns! And don’t forget to check other price patterns like a hammer, hanging man, and many more on this site.