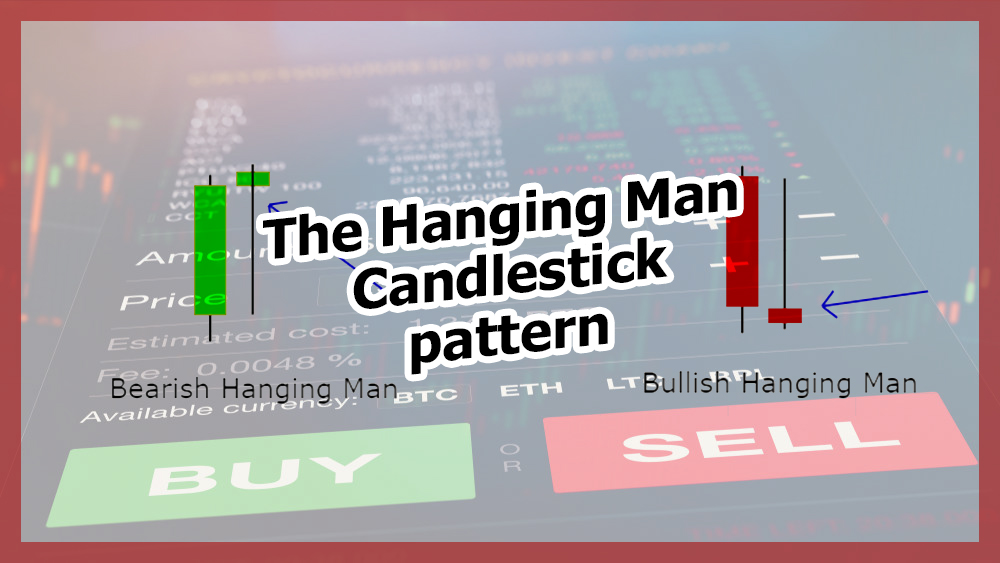
The Hanging Man Candlestick a reversal candlestick pattern and appears after a strong trend. It shows the market is losing its esteem and reversal could be imminent. This pattern is frequently seen in commodities, stocks, and indexes. A bullish hanging man candlestick will appear once the market has a strong downtrend. Similarly, the Bearish hanging man candlestick will appear after a strong uptrend. Let’s understand its formation.
The Hanging Man Candlestick Formation
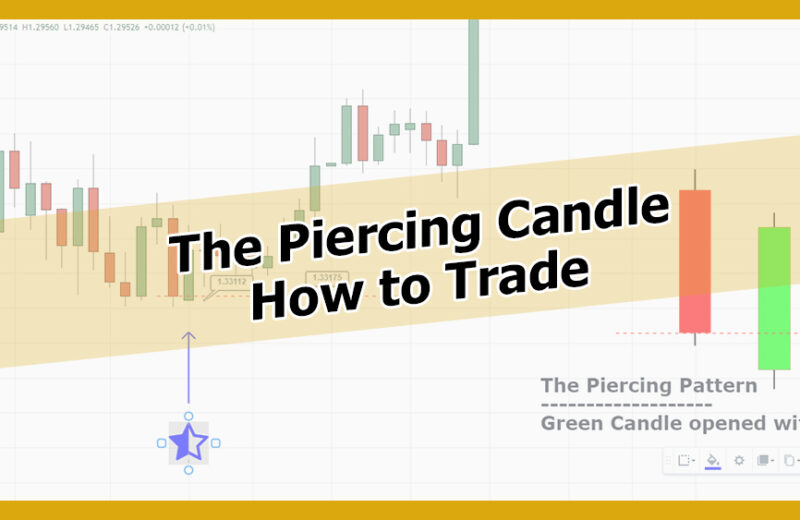
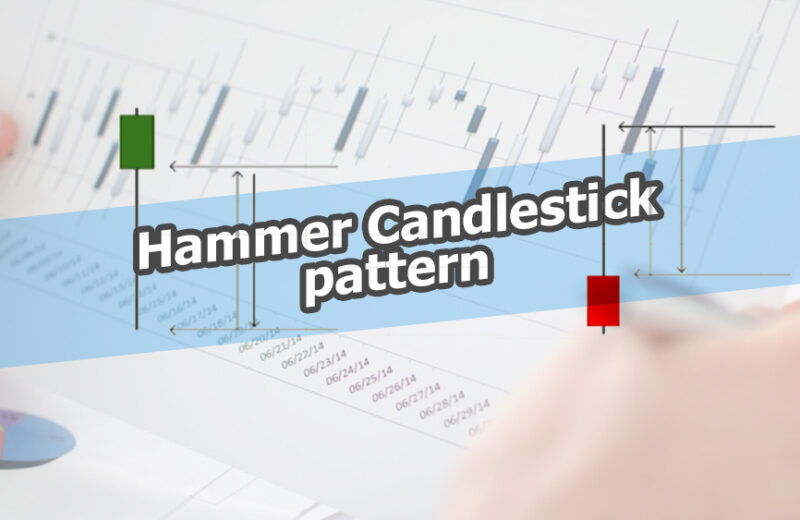
Bullish Hanging man or Inverted hammer appears in a strong downtrend move with a long tail at the bottom and price will close at the bottom of the body. As shown in the picture below; it’s obvious to see the long tail at the top that shows the seller momentum pushed the price all the way to the bottom but it closed near to the bottom. It will have a small body but a long tale on top.

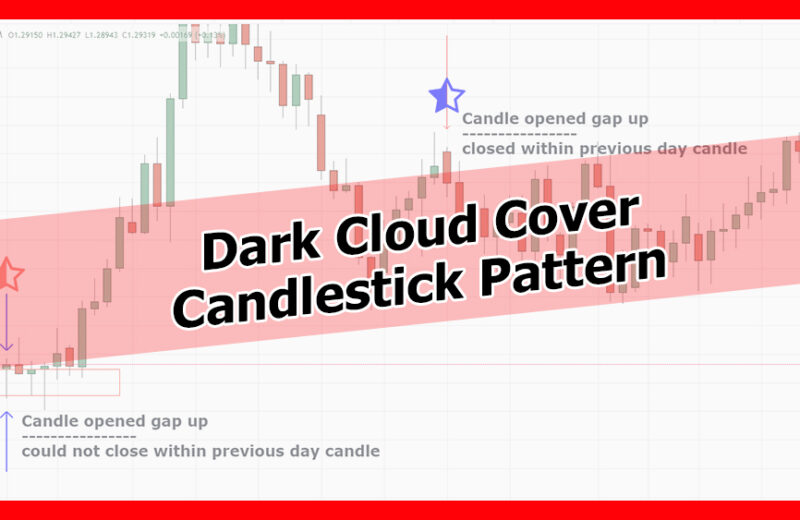
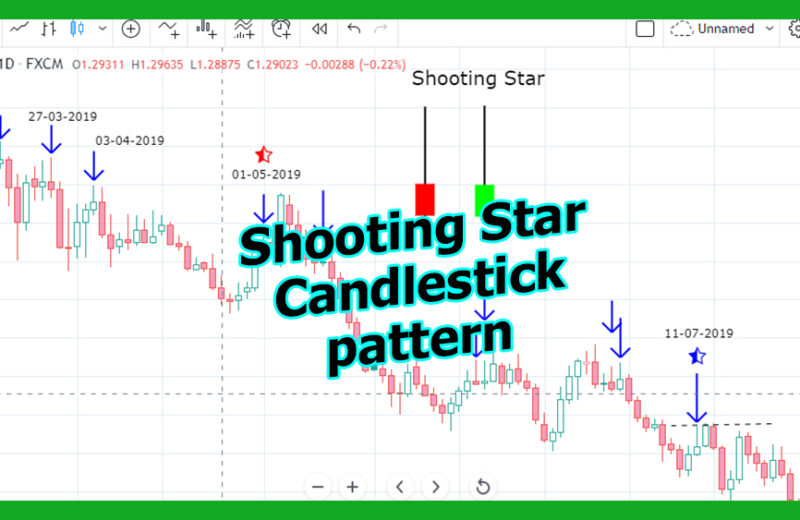
Bearish Hanging Man appears once the market has a strong upward move and then seller take control of the market. Bearish hanging man will have long wick upward and price closing near to the bottom of the candle. After bearish hanging man candle, price usually changes the direction.

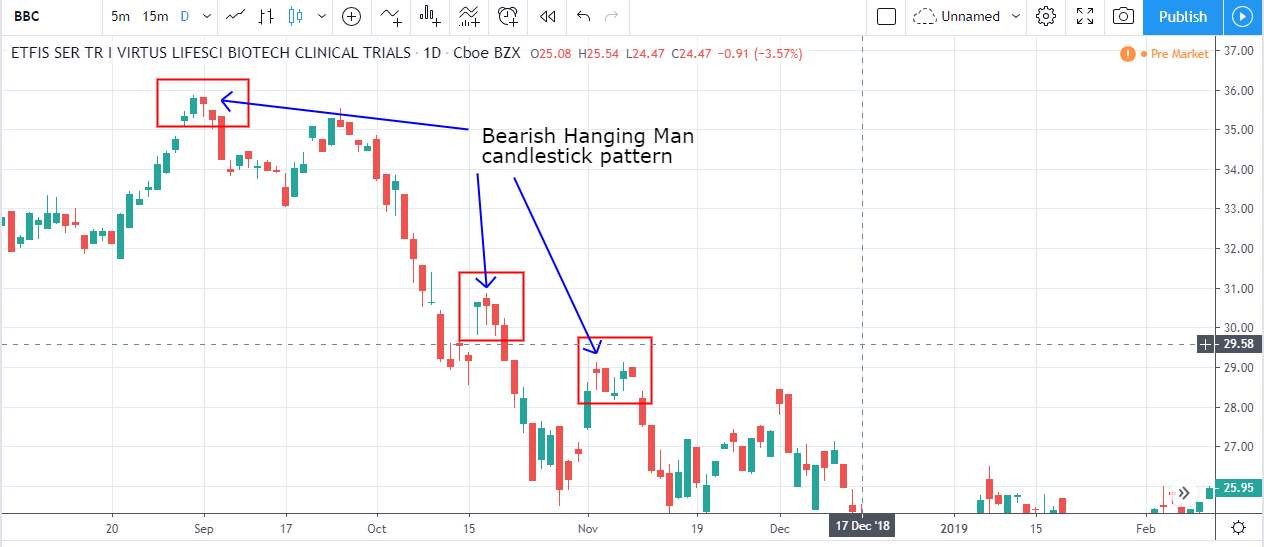
Bearish Hanging Man BBC Stock example
Now let’s recognize the pattern with the help of a LIVE BBC Chart. The following picture shows BBC stock price and as the market rally up, we see a hanging man candle at the top. Long wick at the bottom and price closed to the top of the candle with a small body. After hanging man candle we saw the market changes its direction towards down.
Bullish Hanging Man BBC Stock example
The following picture shows a bullish hanging man example. As we can see the market had a strong downward move and then a bullish hanging man candle is formed. The candle itself states that the seller tried to push the price down but couldn’t make the candle into the bear candle. As we can see in the picture, the market changed its direction and moved up.

How to Trade Hanging Man candlestick pattern
This candle is a bit tricky. Sometimes it does give the indication of market reversal but the momentum continues and pushes the market in its usual direction. To trade hanging man candlestick, one must wait for the second candle to close below the body of the hanging man candle.
Take the following BBC chart example picture. We have seen the market formed a hanging man candle. We will wait for the second day to see if the market closed below the body of the hanging man. Once this is confirmed, we place the stop loss at the top of the hanging man wick and trigger the sell order.

As we have seen the example picture, this trade must have given good returns! Don’t forget to check other price patterns like hammer candlestick, engulfing and many more on this site.